-
What We Do
-
AI NavigatorGain clear direction and momentum as your chart your organization’s AI path.
-
AI FoundationsEstablish the essential skills, systems, and mindset to support sustainable AI adoption.
-
Agentic AI LabExplore, prototype, and refine agent-driven solutions to accelerate real-world impact.
-
GovLabAdvance government innovation with practice AI solutions tailored to unique public sector needs.
-
-
Featured
 The AI Agent Advantage: Understanding Your Digital Workforce
-
Some Industries We Support
-
Featured
 Building Canadian Communities with Homegrown AI


Insights
Timing Luck in Factor Rebalancing

A look at how variations in individual factor turnover rates can introduce variance or luck into the performance outcomes of quant factor portfolios
We believe the magnitude of timing luck impact is much larger than most believe, particularly in tactical strategies.”

Corey Hoffstein
When building quantitative factor portfolios there are a wide range of considerations involved from the research to the implementation phases.
This includes, for example, which factors to include, how they interact with each other, as well as practical considerations such as what kind of transaction costs are imposed by rebalancing the portfolio at varying frequencies.
Some of these considerations can also create very interesting impacts on strategy outcomes.
One case in point arises when the turnover of your factor signals is more frequent than the rebalance period of the aggregate factor portfolio.
The more frequent the factor signal turns over, the more sensitive it becomes to what is known as “rebalance timing luck.”
Rebalance timing luck is the phenomenon where a factor portfolio will exhibit large deviations in performance simply due to the dates upon which you arbitrarily decide to rebalance the portfolio.
Example of Rebalance Timing Luck
As an example, we generate a simulation where we take two variations of the same factor from the AlphaLayer factor library.
The factors are both based on % changes, across time, in analyst’s consensus quarterly EPS forecasts, but in one case the % change is based on a very short time horizon (5 Day % Change), and in the latter case it’s based on a longer-term horizon (189 Day % Change) – thus this latter factor variation will exhibit much lower turnover than the former since its scores are changing much more slowly across time, for any given security.
In both cases, we generate backtests of the two-factor variations (5 Day and 189 Day % Changes), doing so for different starting dates. We generate 25 backtests for each factor variation and we rebalance each portfolio every 21 trading days (roughly a month in calendar days).
Because the start dates of the backtest are different, the associated rebalance dates will differ as well across time, although they might potentially overlap on certain days due to chance.
Note the range of start dates is not large: they vary only by 1 trading day difference in each case, and the range of start dates varies between early January 2001 to mid-February 2001.
Below, we illustrate daily cumulative returns to the two different variations. The first chart illustrates the higher turnover factor (5 Day % Change in EPS Forecasts):
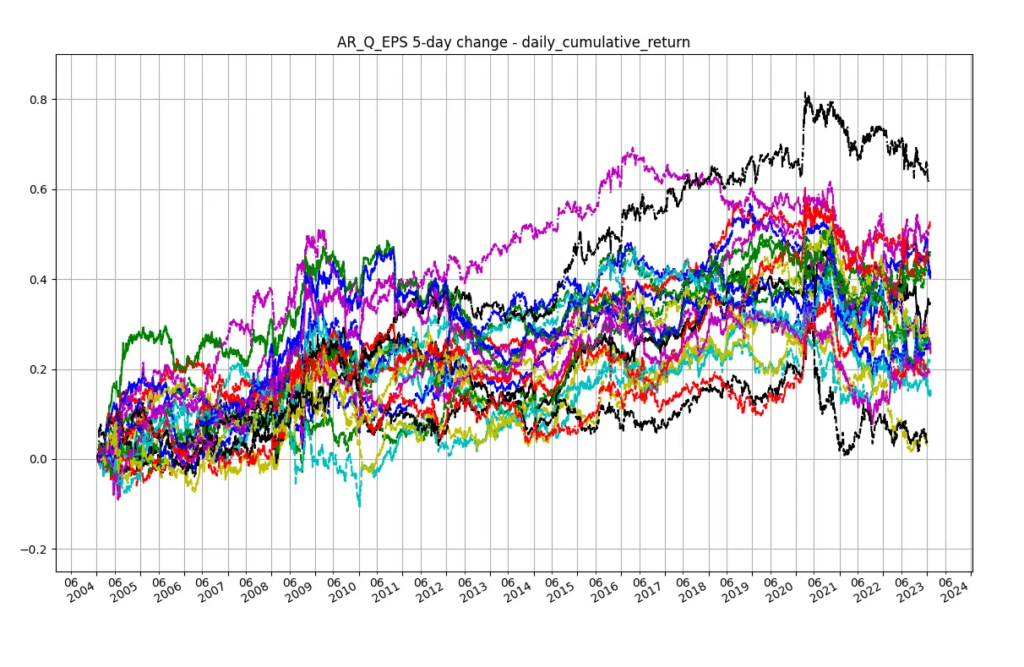
Higher Turnover Factor: Portfolio backtests on Analysts Quarterly EPS Forecasts (5 Day % change) given 25 different start dates.
The second chart illustrates the lower turnover factor (189 Day % Change in EPS Forecasts):

Lower Turnover Factor: Portfolio backtests on Analysts Quarterly EPS Forecasts (189 Day % change) given 25 different start dates.
In each case, we display cumulative returns for each of the 25 backtests, overlapping on the same chart intentionally, to illustrate the large variability in the performance of the high turnover factor, vis a vis the lower turnover variation.
Note that the y-axis in both graphs is the same, so you can visually compare the variation of both cumulative returns, as well as their associated annualized Sharpe Ratio values, which we provide below.
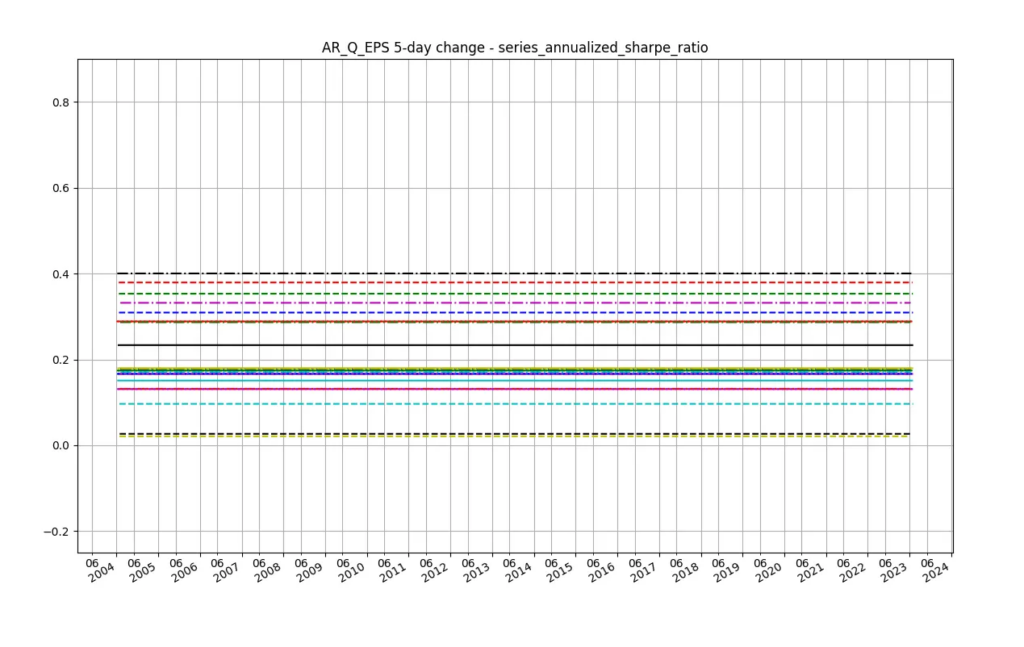
High Turnover Factor: Sharpe Ratios across the 25 backtests of the Analysts Quarterly EPS Forecasts (5 Day % change) factor.
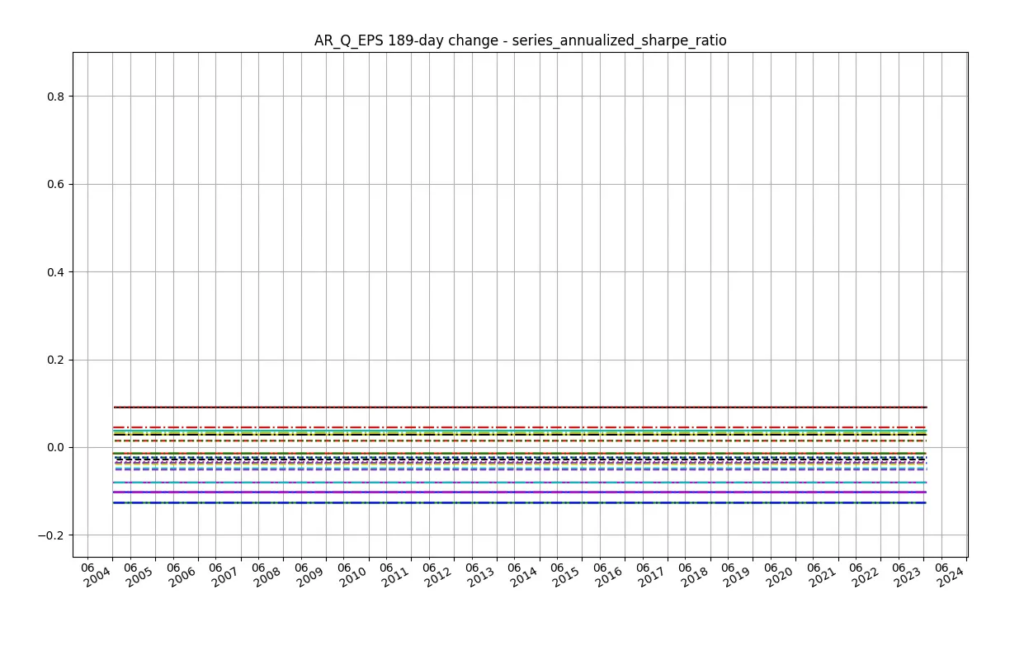
Low Turnover Factor: Sharpe Ratios across the 25 backtests of the Analysts Quarterly EPS Forecasts (189 Day % change) factor.
While the 189-day change factor exhibits worse performance on average, what’s important here is to compare the variation.
Note the standard deviation of cumulative returns on the last day in the 5-day change case is 66.3% times larger than the 189-day change case.
Moreover, the cumulative returns series in the 5-day change case are much less correlated with each other than those in the 189-day change case; the former have an average correlation of 65.8% while the latter exhibit a 77.5% correlation.
It’s also likely that the 189-day change factor doesn’t capture enough information to be as useful as a faster turnover signal; thus the underperformance, despite it not being as influenced by rebalance timing luck.
That said, the point remains that if we allow for a signal that changes faster than our rebalance frequency, the performance will fluctuate randomly due to the arbitrary dates we chose to rebalance.
Note this doesn’t necessarily have to do with the state of the market on those dates, although this can certainly influence it1 , but rather reflective of how we are sampling from our factor signals across time.
In other words, since the high turnover factor changes its values very frequently, we are basically “drawing at random” a value every 21 days.
While the information in the high turnover factor may indeed be useful (and probably more useful than the 189-day change signal), because we are imposing a random selection via the 21-trading-day sub-sampling, at a frequency not consistent with the rate at which the information is being generated, we are both selecting which information to respond to arbitrarily, as well as not rebalancing quickly enough to adapt to the new information the high turnover factor periodically generates.
This ultimately increases the variability of the performance outcome.
In Conclusion
In the rebalance timing luck example, we illustrate how variations between the rebalancing of a factor portfolio and individual factor turnover rates can introduce unintended variance (luck) into the performance of the portfolio.
This is far more of a bug than a feature in the factor portfolio construction process. Ideally, we want to remove randomness wherever we can as markets already have more than enough of it to go around.
It is key to have a strong understanding of all aspects of the factor strategy development process and where potential performance leaks can appear – and how to mitigate them!
Something our team strives to improve on every day, every strategy.
- For example, choosing rebalance dates that coincide with more volatile market periods will be more susceptible to rebalance timing luck, even if rebalance date frequency is less than signal turnover.